How Smart Teams Use Layered Data to Drive Better Content Decisions
Learn how top content teams combine instinct with layered data signals to shape strategy, secure buy-in, and create content that drives results.



Many content specialists rely on instinct to pitch ideas.
Think editorial judgment, audience empathy, and leadership preferences.
Sometimes it works brilliantly. Other times, you spend months creating content nobody wants.
The truth?
Gut feeling alone isn’t enough anymore.
Smart content teams are using both instinct and data to make decisions that actually stick.
The short version: no single dashboard can justify a content decision on its own, so the teams that get this right read several signals side by side and keep a rule for what to do when those signals contradict each other. Below are the layers worth tracking, and the tie-breakers that stop a contradiction from turning into a stalemate.
Why instinct alone isn’t enough
Long story short: economic pressure is forcing content teams to justify every decision. Nobody gets to green-light a piece just because they have fallen in love with the idea any more.
Budgets are getting slashed. Layoffs hit marketing teams first.
AI tools can pump out generic articles in minutes, making leadership question why they need human specialists and writers at all (which is very wrong, if you ask me).
At the same time, the zero-click environment means your best content might build brand awareness and drive leads without attracting direct traffic.
All this creates a measurement gap that pure instinct can’t bridge.
However, the solution isn’t tying every blog post to direct revenue. Content doesn’t work like paid ads.
Instead, you need tracking across multiple dimensions: brand awareness, pipeline influence, AI visibility, social engagement, etc.
The data layers that strengthen content decisions
The signals worth tracking: search intent, brand awareness, social engagement, conversions, and audience feedback loops.
Search intent signals
Search intent data shows you which content ideas have real audience demand before you start writing.
Here’s how you can shape your analysis:
Question mapping: Go where your customers actually ask questions: sales calls, Reddit threads, Quora, and customer support tickets. Record the exact phrases they use and prioritize these topics when planning content.
Keyword validation across platforms: Compare Google keyword volumes (via Semrush’s Keyword Magic Tool) with ChatGPT search trends (via the AI SEO Toolkit) to find topics that work in both traditional SEO and AI search.
Content gap analysis: Check the existing content for your priority topics and keywords. Search your target keywords in Google, then ask the same questions in ChatGPT. If ChatGPT gives generic, surface-level answers while Google shows thin competitor content, you’ve found an opportunity to create something deeper and more useful.
For example, Semrush’s sales specialists kept hearing “Will Google penalize my AI-generated content?” from prospects evaluating our AI writing tool.
I used Semrush to check whether there was any search volume for related queries such as “Does Google penalize AI content?” and “Can AI content rank?”
It turned out that people are indeed searching for these keywords:

Then I looked at the top-ranking content on Google and on AI platforms such as ChatGPT and Perplexity.
Everything was speculation without any concrete data.
So, we analyzed 20,000 articles and published research on whether AI content can rank on Google.
One update worth flagging, because this article has been live a while: Google has since put its own position in writing. Its spam policies target scaled content abuse, which Google defines as producing many pages that add no value for users, and the policy names generative AI only as one of the ways teams do that. Production method is not the violation. That does not make the research redundant, but if a prospect asks you the question today, you can point at Google’s own documentation before you point at anyone’s study.

The result?
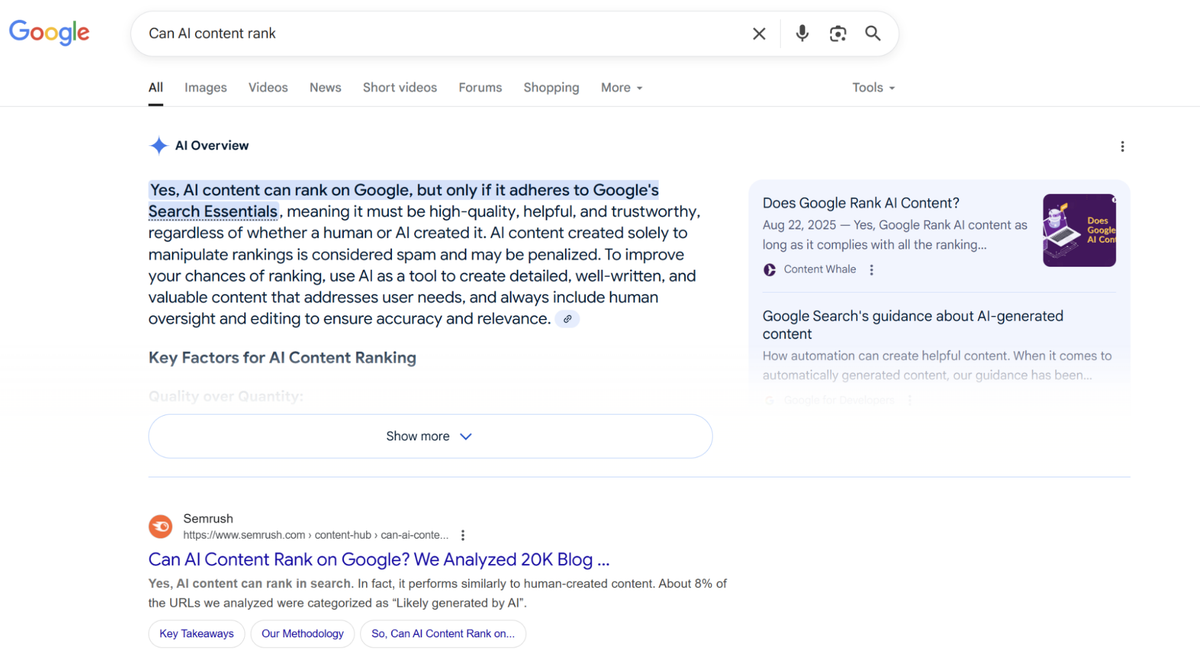
Our piece ranks high both on traditional SERPs:
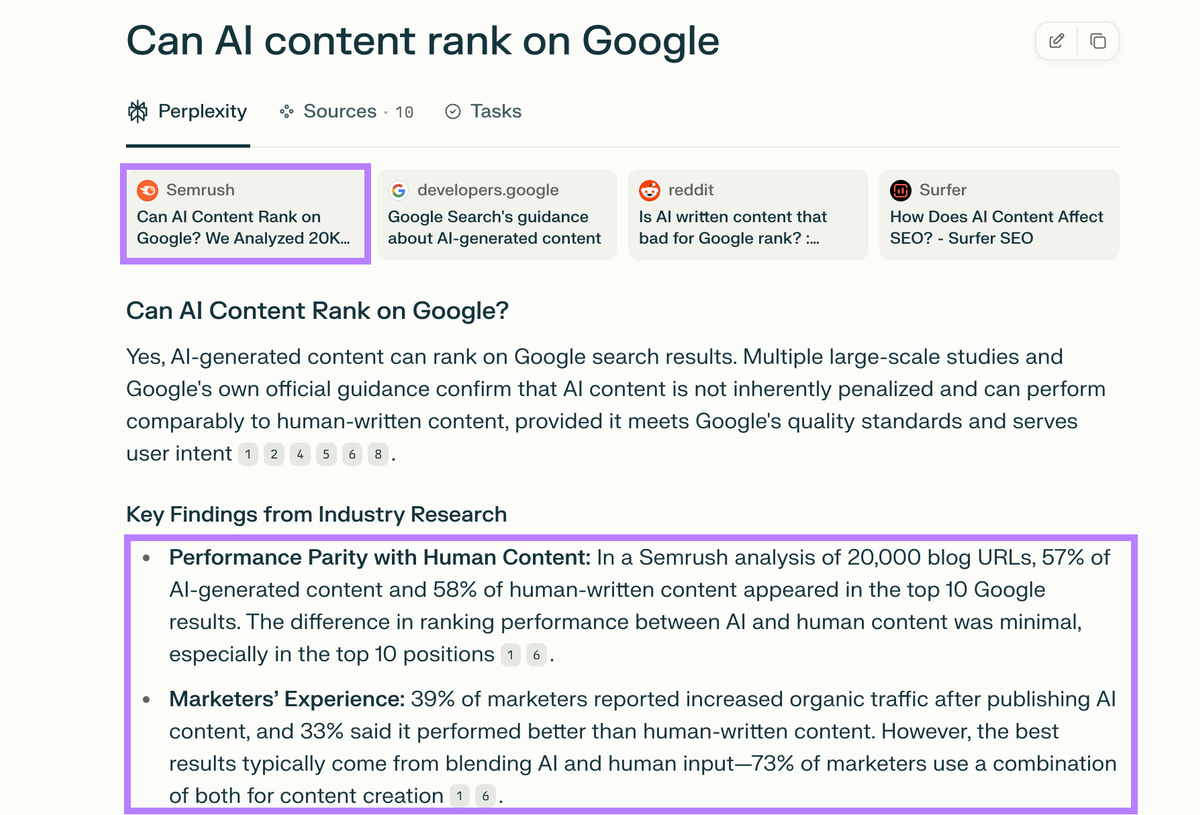
And in AI chatbots, attracting high-intent users and helping us address key blockers in the buying process.
Brand awareness metrics
Brand awareness metrics reveal whether your content is building recognition and trust, even when it doesn’t drive direct traffic.
I’ve always believed that one of content’s key roles is exactly this: helping businesses connect with customers.
Here’s how you can approach this:
Sentiment tracking: Monitor how people talk about your brand across social platforms and forums by using a tool like Brand24.
Branded search growth: Watch for increases in people searching directly for your company name and see whether it correlates with recently published content via Google Search Console.
Share of voice: Measure your brand’s presence in industry conversations relative to competitors (Brand24 is also my go-to tool for this).
AI brand mentions: Track how often AI tools mention your brand versus competitors when users ask relevant questions using tools like Semrush’s AI SEO Toolkit.
AI citation frequency: Analyze how often your content or research is cited as a source in AI-generated answers, which can also be done via the AI SEO Toolkit.
In fact, AI visibility is a major opportunity for justifying content marketing investment today, whether to stakeholders or clients.
Social media engagement metrics
Social engagement patterns predict which content formats and topics will drive business results.
Social media is also a powerful channel for generating leads and conversions, not just for B2C and ecommerce brands but also for B2B.
For example, David Baum, Relato’s CEO, relies on LinkedIn as a steady source of qualified leads.
“I post and engage consistently on LinkedIn every weekday. There, I share my perspectives on our industry, the views of our team, and I also promote fresh content, product updates, and news. This activity contributes directly to 10 – 15 customer meetings a week (intros, discovery, and demos).”
David Baum, Co-Founder and CEO at Relato
Here are the key signals to look out for:
Professional relevance signals: Saves, shares, and comments from your ideal buyers.
Community validation: Reddit upvotes and meaningful discussions in relevant subreddits, as well as messages and overall sentiment on other community platforms.
Direct relationship building: DMs and connection requests generated by specific content pieces.
Amplification potential: Content that resonates so strongly with your team and customers that they naturally share it, extending engagement and reach.
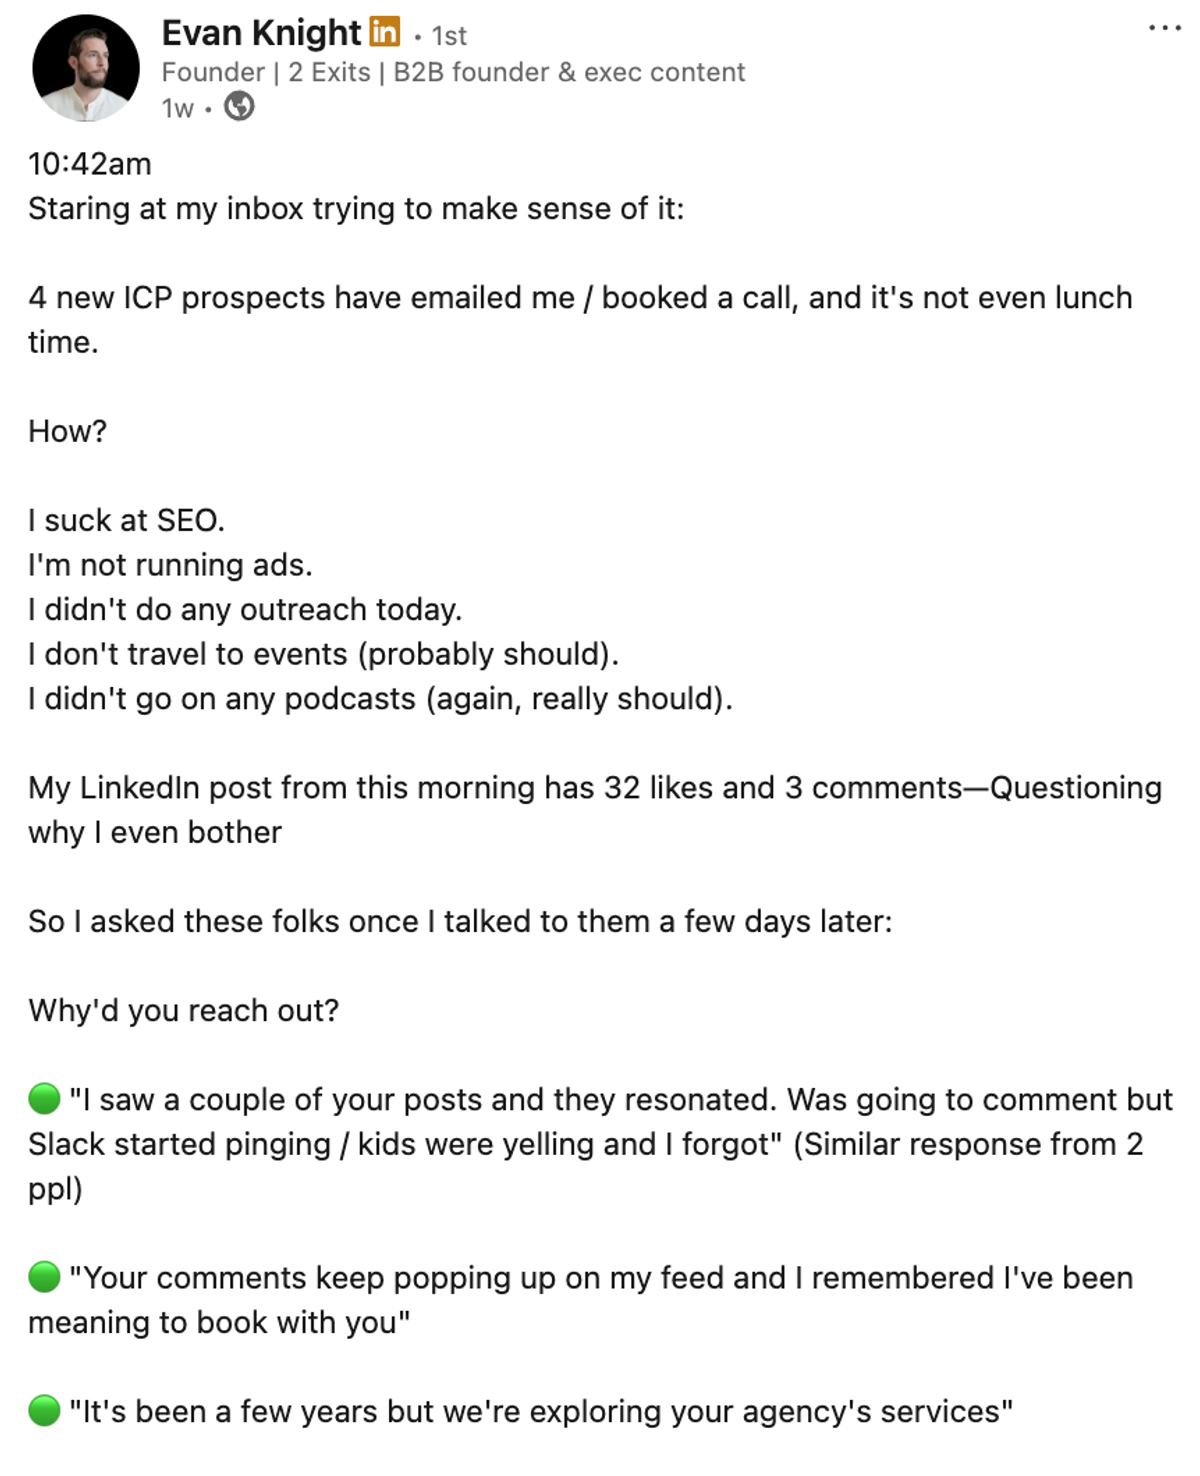
Industry experts like Evan Knight, Founder of Thoughtful Content, also stress that sharing thought leadership content can directly drive pipeline growth:
Turn social signals into content that converts.
Relato helps teams track what resonates, connect engagement data to strategy, and plan content that drives pipeline growth.
Audience feedback and closed loops
Audience feedback signals show whether your content strategy aligns with customer needs and market conversations.
These qualitative signals complement your quantitative data by revealing gaps between what you think your audience wants and what they actually need.
Here’s what you can measure:
Sentiment around your content: Use Brand24 to monitor when people discuss your brand and content topics. For example, you can track keywords like “blog” or “guide” alongside your brand name to catch content references. Then, review the context and see if mentions are positive, neutral, or negative.
Engagement quality indicators: Compare the length and depth of discussions around your content, whether on your blog, social media, or forums. Track if people ask follow-up questions, share personal experiences, or challenge your points.
Follow-up question patterns: Create a simple form for sales and support teams to log what additional questions people ask after consuming specific content pieces.
Content sharing context: Monitor social media to see how people describe your content when they share it. The added context reveals whether it genuinely resonated and why.
For example, I always carefully read LinkedIn posts referencing my content, and the feedback users leave in the comments.
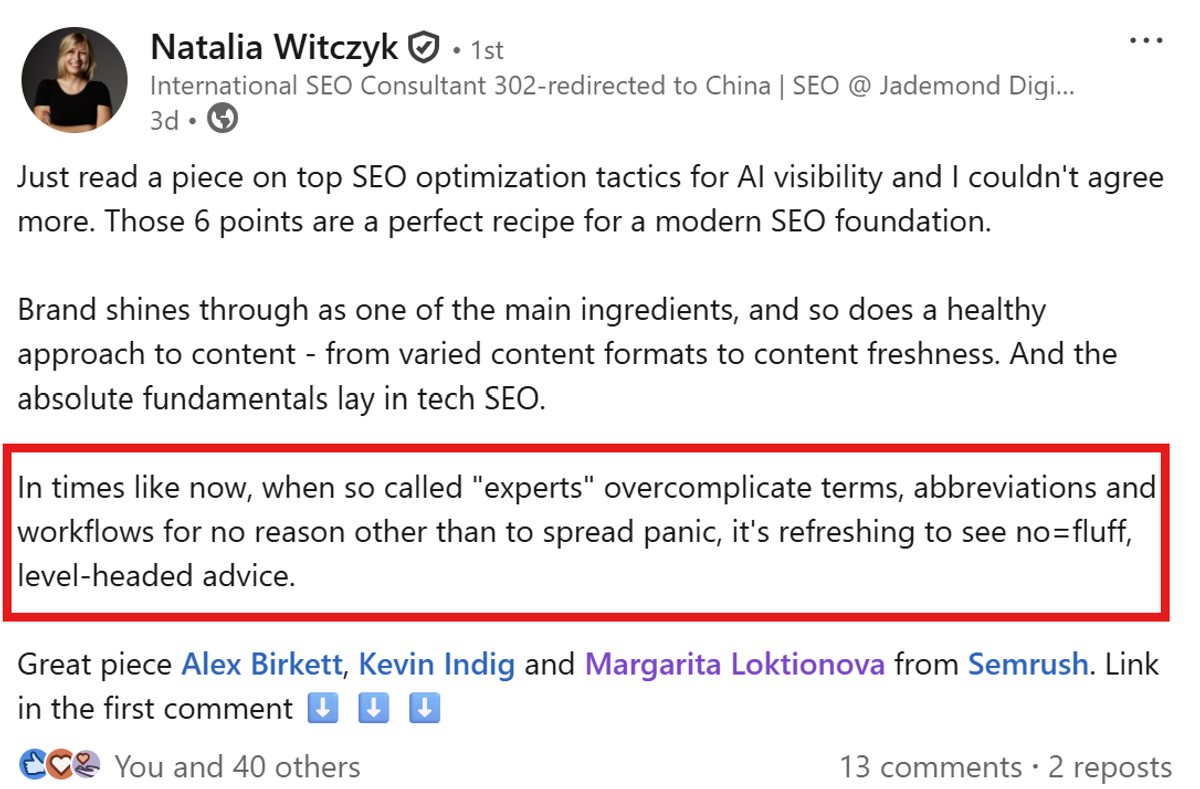
In this post, Natalia reshared a recent article with AI visibility tips:
My takeaway?
The article stands out because it’s simple, grounded, and fluff-free compared to the alternatives.
That highlights an important differentiation point in our niche that I’ll continue to use for my content.
Content performance data
While not every content piece will directly drive revenue metrics, tracking its overall contribution and ROI is always a good idea.
This is especially important for product-led, sales enablement, and other bottom-of-the-funnel content.
For example, you can track:
Assisted conversions: Track which content pieces contribute to conversions like leads, trials, and purchases using multitouch attribution, since most content nurtures prospects through the buying journey rather than driving immediate purchases.
Pipeline velocity correlation: Measure how prospects who engage with specific content move through the funnel and make sure your sales team logs the sales enablement assets they use in the CRM.
Sales team content usage: Monitor which resources your sales team shares most often in demos and follow-up calls. Track which assets prospects request or reference during conversations using CRM notes, call recordings, or analytics from tools like Seismic.
Content influence on deal size: Analyze whether prospects who engage with certain content pieces (like case studies, ROI tools, or implementation guides) close with higher contract values than the baseline average.
How to combine media coverage with competitor signals
Most teams read their own numbers in isolation. The sharper move is to place your data next to two outside layers: the media coverage your brand earns, and the signals your competitors send. Together they show you where the conversation is heading before it reaches your traffic reports.
Here’s how to layer them:
Map media coverage to content topics: Pull the press mentions, podcast appearances, and guest articles your brand earned this quarter. Note which themes keep surfacing. If three journalists asked about the same trend, that trend has demand your blog can serve while it’s still fresh.
Read competitor moves as demand signals: Track which topics competitors publish on repeatedly, which of their pages earn backlinks, and where they show up in AI answers. A competitor doubling down on a subtopic is a paid vote of confidence that the topic converts. Your job is then to find the angle they missed rather than to publish their piece again.
Cross-reference before you commit: When a topic surfaces in media coverage, competitor activity, and your own search intent data, you have converging evidence rather than a guess. That overlap is where you place your bigger bets.
The point is to read three layers side by side, so a pattern any single tool would miss becomes obvious. Another dashboard on its own will not produce that. A topic backed by press, competitor behavior, and search demand is also an easy story to tell leadership, and a far easier one than proving the ROI of a single blog post.
Operationalize AI visibility signals across content teams
AI visibility is its own layer now, and it works best when the whole team can see it. Track how often ChatGPT, Perplexity, and Google’s AI answers cite your brand versus competitors, then put that view next to your media and competitor picture. When editorial, PR, and GTM read the same signals, you stop trading anecdotes and start planning from one map. The wider argument for treating discoverability rather than rankings as the thing you manage sits in our new SEO playbook, which also covers how often to refresh a page to keep it in the citable pool. That only holds if the signals reach the work, which is the harder half of turning a content strategy into shipped work: a visibility dashboard nobody briefs against changes nothing.
What to do when your data layers disagree
Most advice about layering data stops at “look at more signals”. The awkward part starts straight after that, when the signals contradict each other. Say search volume tells you a topic is dead, two prospects asked about it on calls last week, and the LinkedIn post on it pulled plenty of comments and not one trial.
A conflict like that is rarely noise. It usually means your layers are watching different moments in the buying cycle, so the layer that looks wrong is early rather than wrong.
Here is what each layer is genuinely good for, and where it will mislead you:
| Layer | What it tells you | Where it misleads you |
|---|---|---|
| Search intent | How many people already phrase this as a query | Silent on demand that has not reached Google yet, or that buyers now take to an AI assistant instead |
| Brand awareness | Whether people reach for you unprompted | Moves far too slowly to judge any single piece |
| Social engagement | Which framings provoke a reaction | Rewards your loudest audience, who are rarely your buyers |
| Audience feedback | What readers actually needed from you | Tiny samples, and the people who bother to reply are unusual by definition |
| Performance data | What the content did to pipeline | Lands months after the decision it should have informed |
| AI visibility | Whether answer engines cite you and how often | Young measurement, and the tools still disagree with each other |
Four tie-breakers that have held up for me:
Sales conversations outrank search volume on bottom-of-funnel topics. If prospects keep raising an objection on calls, the demand is real whether or not anyone types it into Google. The AI-penalty research above started in exactly that gap, and the keyword data only confirmed it afterwards.
Search volume outranks sales anecdotes on top-of-funnel topics. Your sales team only speaks to people who are already in a buying cycle. For everyone earlier than that you need proper audience research rather than a summary of last week’s calls.
When one layer dissents and the rest agree, publish and instrument. Write down the number that would prove the dissenting layer right before you ship, then go back and check it. A prediction you recorded beats an argument you won.
When every layer is thin, say so. Thin data is a finding, not a gap to paper over. It normally means you are early to a topic, which is either the best or the worst reason to write about it, so size the bet accordingly instead of dressing a guess up as evidence. If the plan those signals feed is still half-built, settle the B2B content strategy framework first and let the layers argue inside it.
How to combine insights & instinct
The most effective content decisions happen when data validates opportunities and instinct shapes the creative execution.
The workflow below connects both.
Use signals to shape your approach
Start with the insights you’ve collected: search intent showing demand, brand awareness metrics revealing market gaps, and social engagement patterns highlighting what resonates.
These signals point you toward content opportunities that have genuine audience interest behind them, and real potential.
Then, apply your editorial judgment to find angles competitors haven’t explored.
The data gives you a direction, but it’s up to you to find the fresh angles, unique stories, or underexplored perspectives that competitors haven’t tapped into yet.
Build systematic data collection workflows
Next, bring the signals you’re already collecting into one shared workspace.
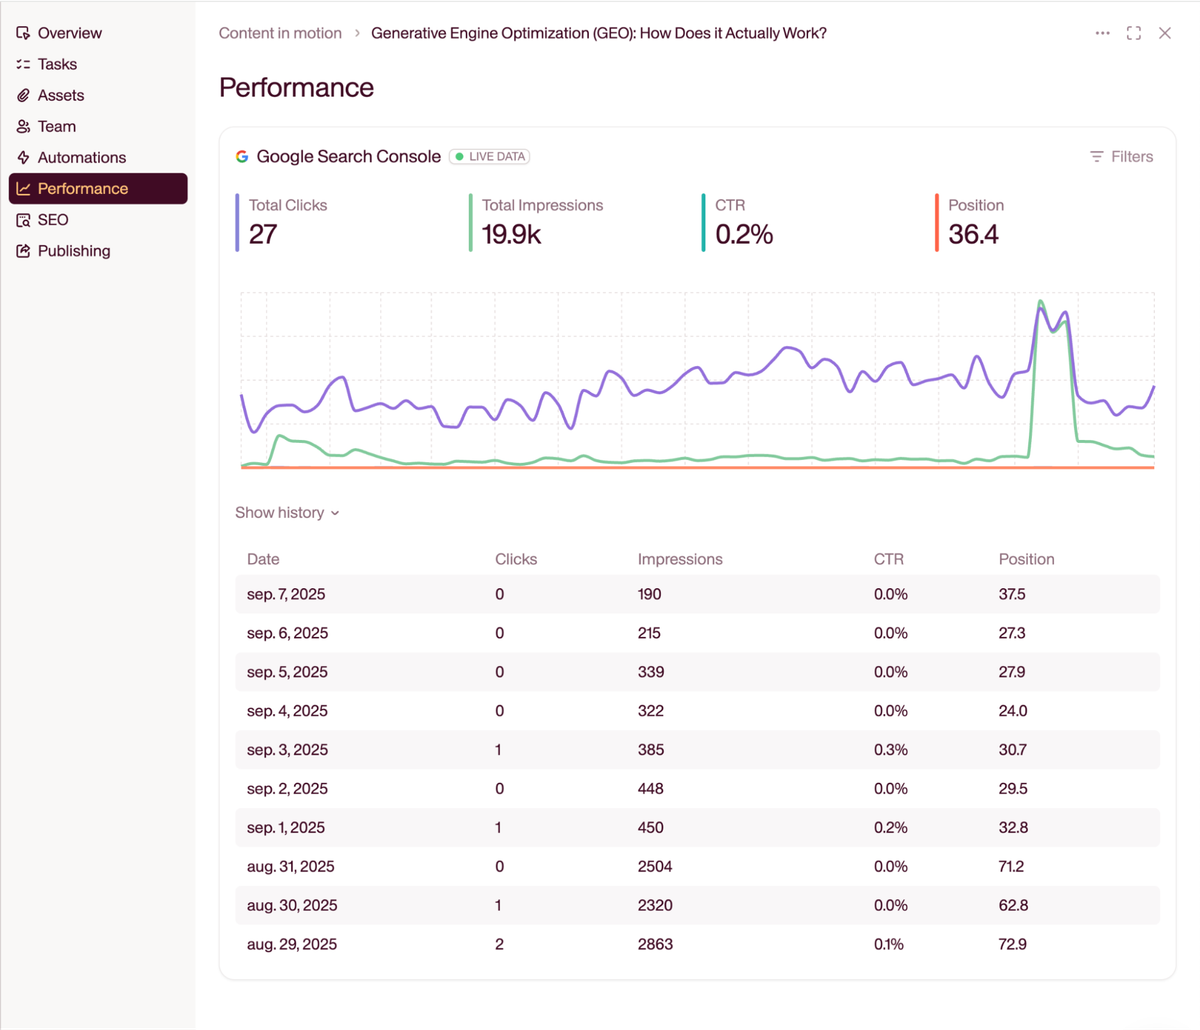
If you’re using Relato, you can connect your Google Search Console account to see which pages are gaining visibility, earning impressions, or trending upward across your library. This gives you a clear view of what’s resonating in search without digging through spreadsheets.
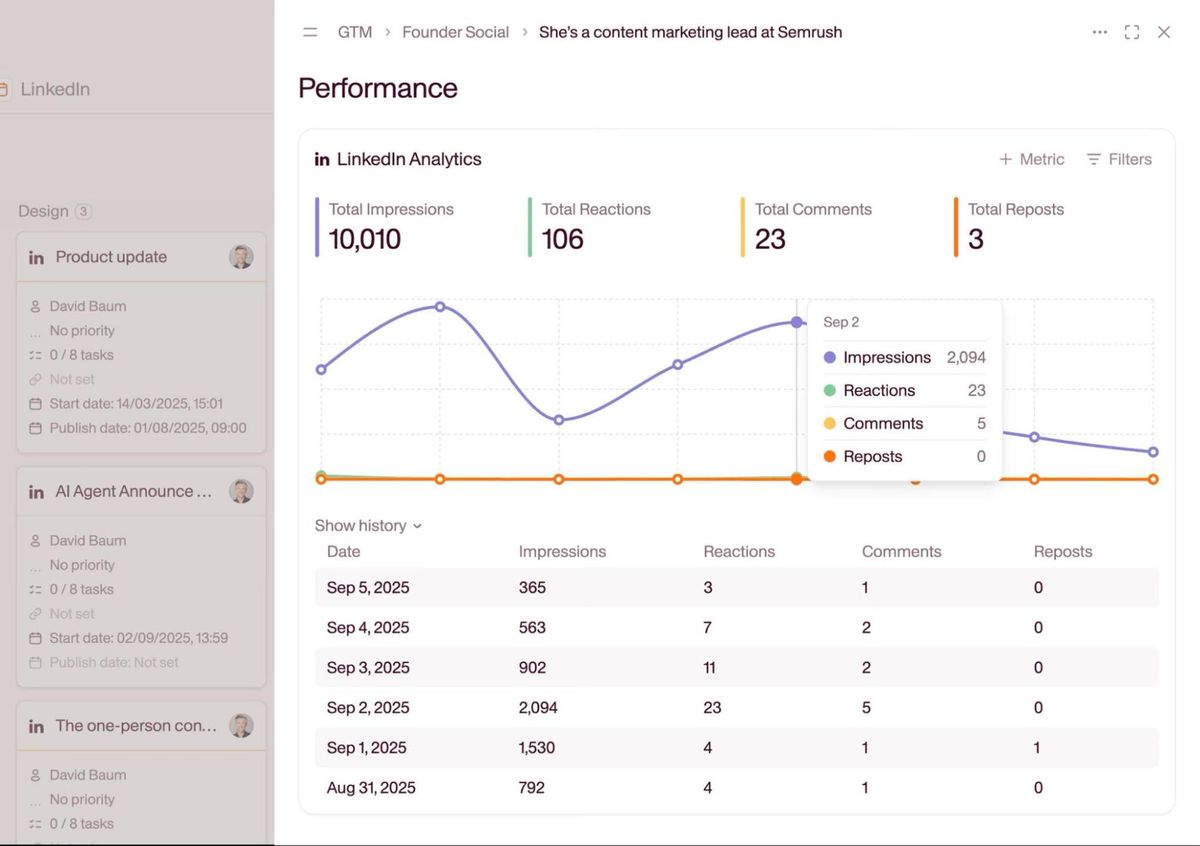
From there, you can add snapshots of key social engagement metrics and performance data (even if it’s tracked manually or pulled from native analytics tools).
The goal isn’t to replace the tools you use. It is to review these signals together, in context, with your editorial and GTM teams.
Once you have a shared view of search lift, social resonance, and qualitative feedback, schedule a simple weekly editorial review.
Look for:
Topics that appear across multiple channels
Formats that consistently perform well
Content that surfaces in sales conversations
These recurring patterns become your clearest strategic signals.
Use data to make the story complete
Finally, turn validated opportunities into compelling pitches by building mini business cases that combine creative insight with hard evidence.
This approach helps secure stakeholder buy-in (and budget) while giving you more confidence in planning content. If getting leadership on board is your real bottleneck, our guide to winning internal buy-in for your content strategy goes deeper on the pitch itself.
Here’s how:
Lead with the hook, back with proof: Start with the narrative that captures attention, then support it with converging data points from multiple sources.
Show business impact: Connect content performance to pipeline velocity, deal size, or other metrics leadership cares about.
Create feedback loops: Track which data-backed predictions actually delivered results to improve future pitch accuracy.
For example, when justifying a content idea, pitch something like:
“Our sales team reports that customers hesitate to purchase our AI writing tool because they worry Google will penalize their websites. We’re seeing over 100 monthly searches for related keywords like “Does Google penalize AI content”, low volume but high intent, and we expect it to grow. We’ve also noticed frequent discussions on LinkedIn and Reddit with people asking questions and sharing speculation about this topic. We propose conducting original research to determine if Google actually penalizes AI-generated content, then creating content that attracts search traffic, generates social media engagement, and directly addresses our biggest sales objection, helping us attract more leads and close deals faster.”
Then list the specific metrics you want to track, such as lead volume and pipeline impact, and report how your content performs against them.
Common pitfalls and how to avoid them
Measuring content performance may look simple on paper, but in practice, it’s anything but.
Teams need to connect various data sources, justify the importance of non-revenue metrics to stakeholders, and interpret the multidimensional insights they collect.
Here are some of the most common mistakes that slow down this process, and ways to address them:

For example, in 2025 we hosted an AI visibility webinar together with Emilia Moller, a LinkedIn expert.
The response was impressive: over 2.5k registrations, extremely positive feedback, lots of LinkedIn engagement, and plenty of questions asked during the session.

However, as is often the case with high-level content, we couldn’t track many direct product payments. And of course, stakeholders don’t tend to prioritize webinar engagement metrics.
So, we framed the story around these points:
The number, intent, and sentiment of product-related comments and questions posted during the webinar
Traffic to the tool via the UTM link shared during the session
Post-webinar LinkedIn publications made by attendees, amplifying Semrush’s thought leadership
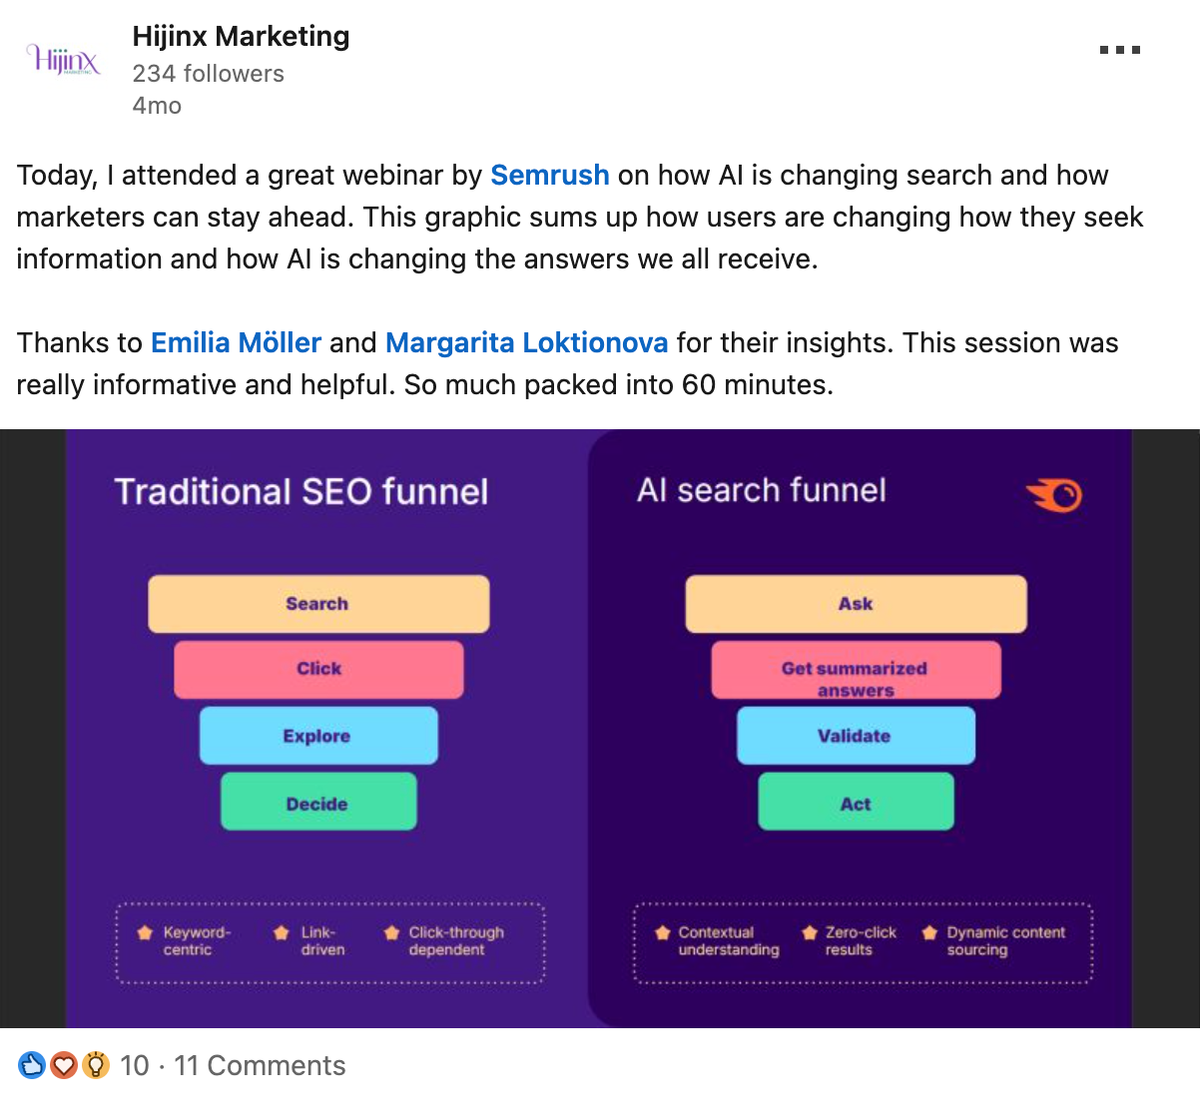
This shows how gathering feedback and data from different sources helps us analyze and demonstrate the value of content.
The most valuable insights emerge when your signals live in one place.
Relato helps content teams see what’s working, and why, so it’s easier to pitch confidently, plan strategically, and move faster.
Blend instinct with data for better content decisions.
Relato helps teams organize signals, track performance, and make decisions that stick.
Frequently asked questions about layered data for content decisions
What should you do when your content data signals disagree?
Treat the conflict as information rather than noise, because the layers usually track different moments in the buying cycle. On bottom-of-funnel topics trust sales conversations over search volume: if prospects keep raising an objection, the demand is real whether or not anyone types it into Google. On top-of-funnel topics reverse that, since your sales team only meets people who are already in a buying cycle. When a single layer dissents and the rest agree, publish anyway, but write down the number that would prove the dissenter right and go back and check it.
How many data layers does a content team actually need?
Fewer than most tool stacks imply. Search intent plus one qualitative source, usually sales calls or support tickets, is enough to make a defensible call on most topics. Add brand awareness, social engagement, performance data and AI visibility as the decisions get more expensive. The limiting factor is rarely the number of signals. It is whether anyone agreed in advance which signal wins when two of them point in opposite directions.
How do teams combine media coverage with competitor signals?
Read them as two outside layers next to your own data. Map the themes in your recent press mentions, podcasts and guest articles, then track which topics competitors publish on repeatedly and where they get cited in AI answers. When a topic shows up in media coverage, competitor activity and your own search intent data at the same time, you have converging evidence instead of a hunch, and that overlap is where you place your bigger content bets.
How do you use data to drive smarter content strategies?
Track across multiple dimensions instead of one. Layer search intent, brand awareness, social engagement, audience feedback and performance data, then look for topics and formats that recur across several of those signals. The data points you toward opportunities with real demand; your editorial judgment finds the angle competitors missed. The decision sticks when validated demand and a fresh angle meet.
How do you operationalize AI visibility signals across content teams?
Put AI citation and mention data in the same shared view as your search, social and feedback signals so editorial, PR and GTM all read the same map. Track how often ChatGPT, Perplexity and Google’s AI answers cite your brand versus competitors, then attach that to the topics you plan. Shared signals replace anecdotes, so the team plans from evidence rather than arguing from separate dashboards.
How do you measure content ROI when content doesn’t drive direct traffic?
Stop tying every post to a direct sale and measure influence instead. Use multi-touch attribution for assisted conversions, watch pipeline velocity for prospects who engage with specific pieces, and track which assets your sales team reuses in demos. Pair those with brand awareness and AI visibility signals so the non-revenue impact is visible too, and swap the vanity numbers for metrics that survive a finance review.